Screenshots & Features
Superb Dashboard Experience
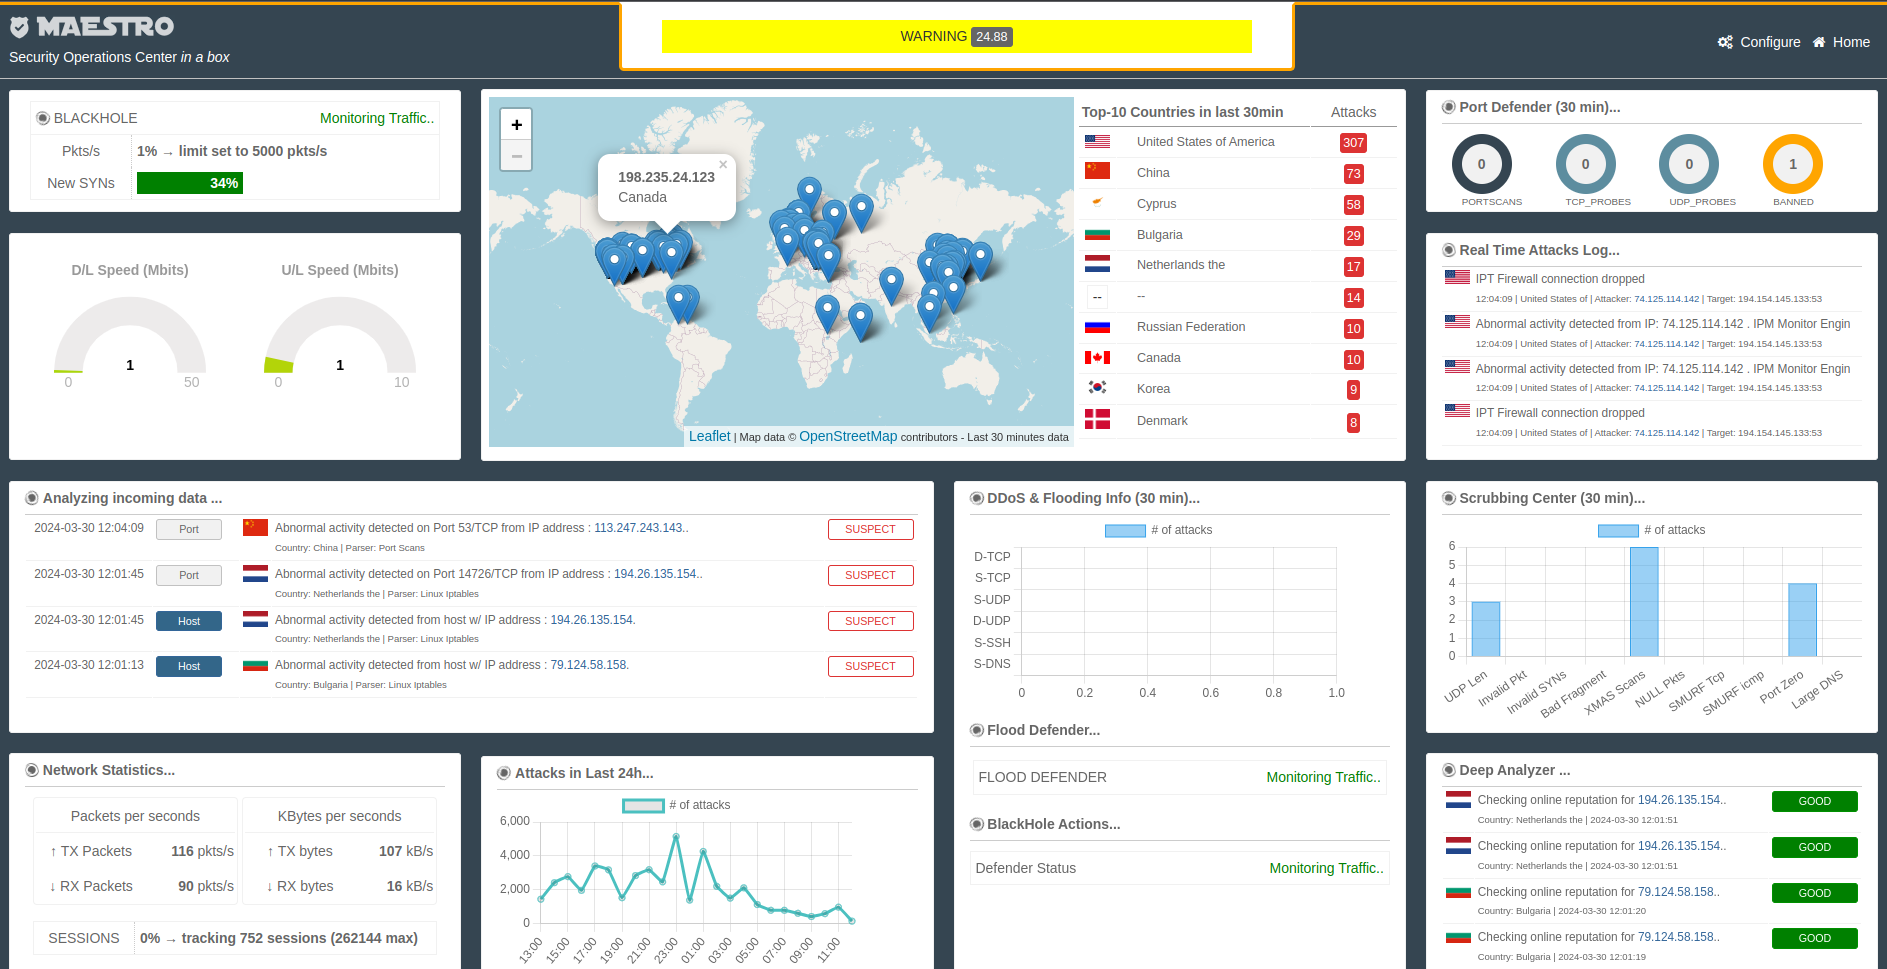
Maestro's dashboard provides a comprehensive overview of your network's security posture. It includes detailed information about attacks, analysis of attack patterns, escalation, ban and unban information, network statistics, DDoS information, and scrubbing center details.
|
 |
NOTE: Below pictures are from an older version of Maestro named SPA (Site Protector Appliance)
Real Time Attack Monitor
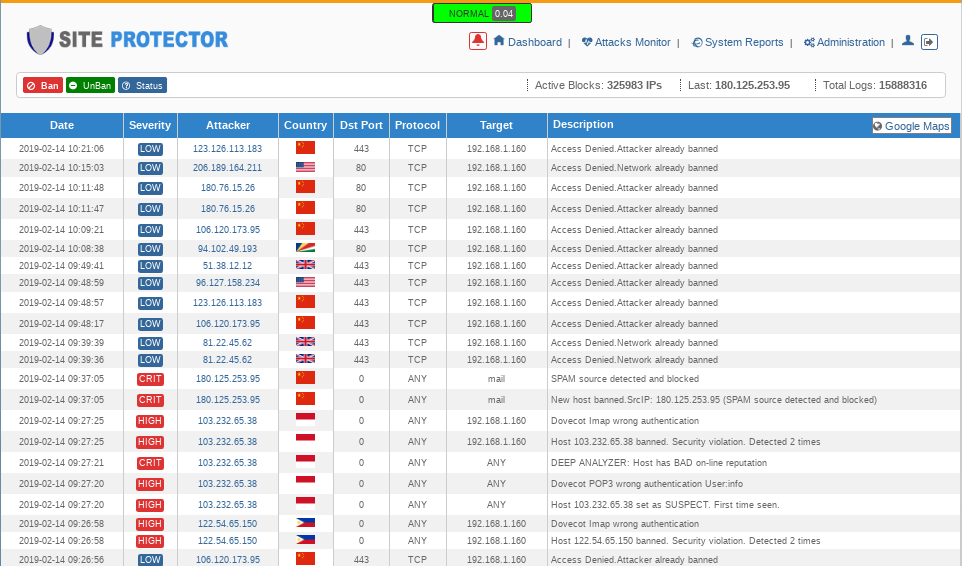
View in real time who attacks your systems. Details include : source IP, country , port, protocol, attack target, attack severity and the Maestro action
|
 |
Clean Dasboard
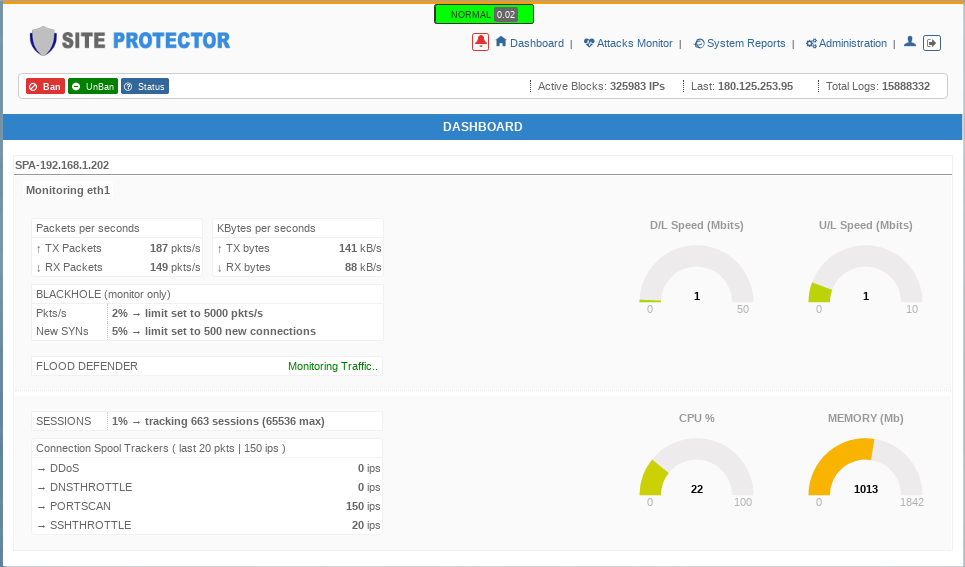
Clean Dashboard with network and system statistics, SYN attacks monitor, FLOOD defender , SESSION status and DDoS IP tracker.
|
 |
Management Reports
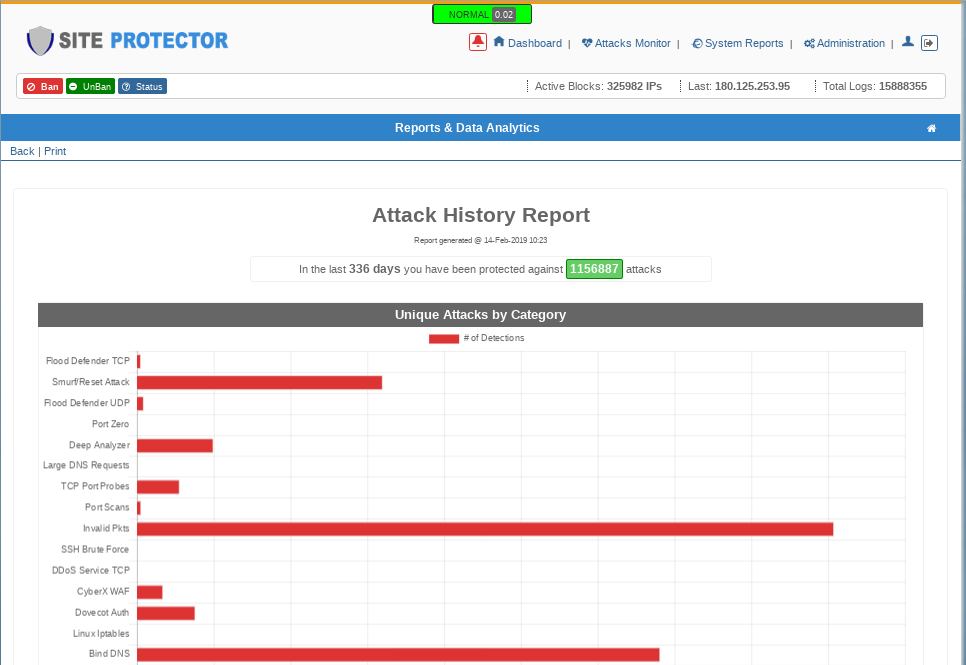
Detail reports easy to understand and use on any Management presentation. Designed in a way that non-security people may understand.
|
 |
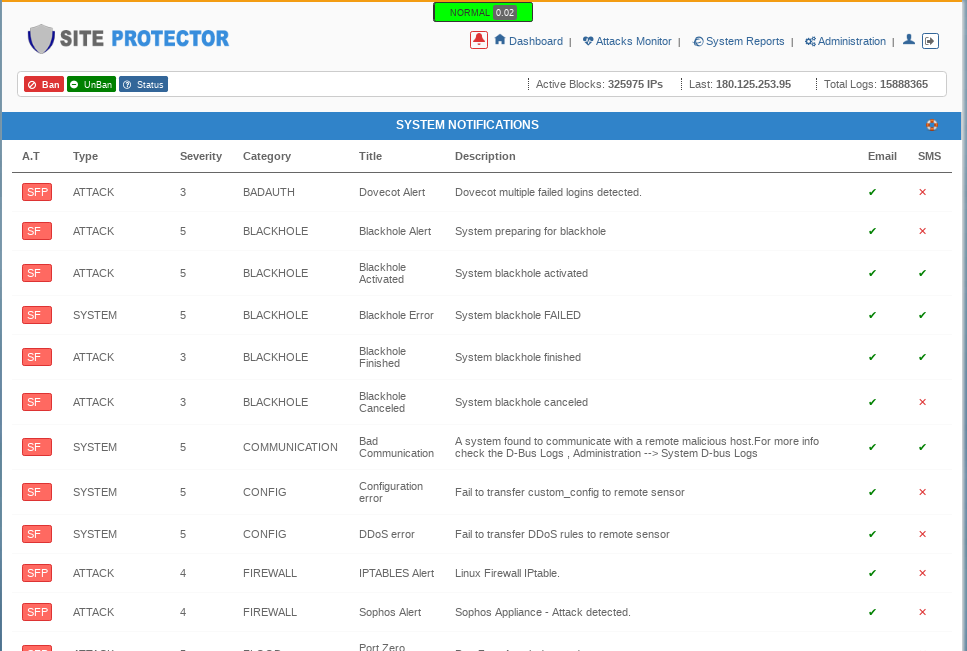
Advanced Notification System
SPA includes an advanced and flexible notification system that can be customized for any enviroment. As a start, it can be set to 'Smart Mode' where the system will send selectively any alerts worth your attention based on your configuration.
|
|
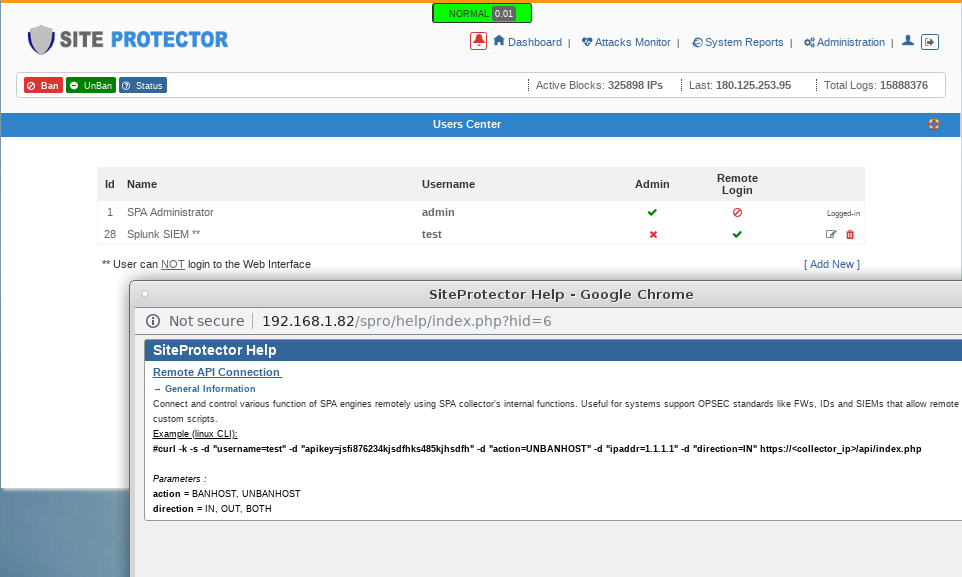
Multi User / OPSec & API
Supports multi-user with three main pre-defined roles : Super Admins, Local Admins and Remote Users. A Super Admin is able to see and change ALL systems parameters, the Local Admins can manage the system while is running (ban,unban hosts, generate reports, view logs etc . The Remote Users are able to control basic functions of the Maestro/SPA ecosystem using an easy to use remote API with basic functionality.
|
|
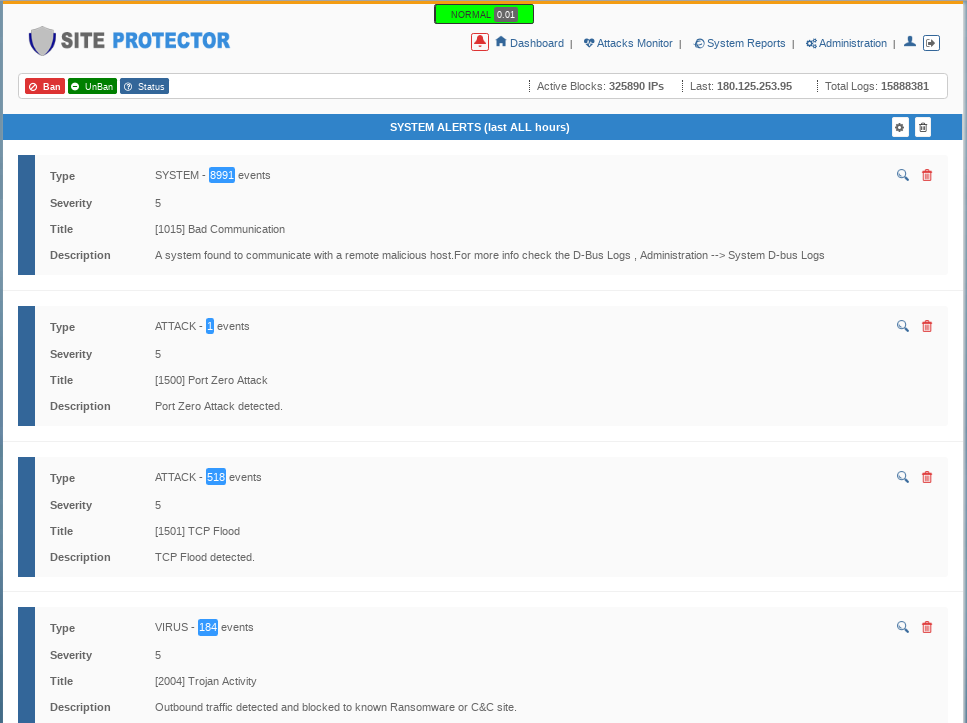
System Alerts
System alerts are grouped by category and severity. Using the 'alert dashboard' the system administrator can easily identify any critical threads / attacks to your infrastructure.
|
|
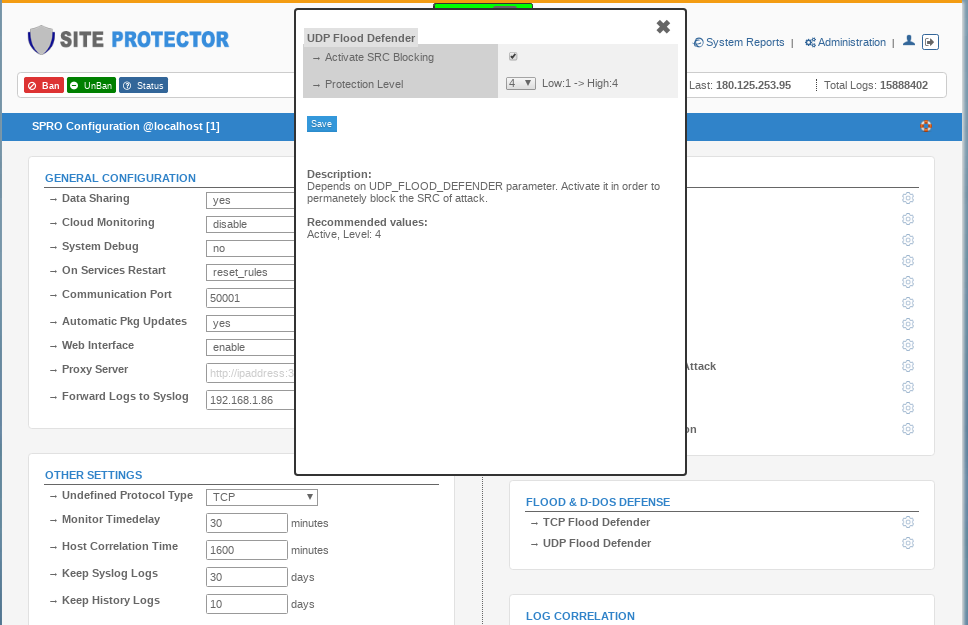
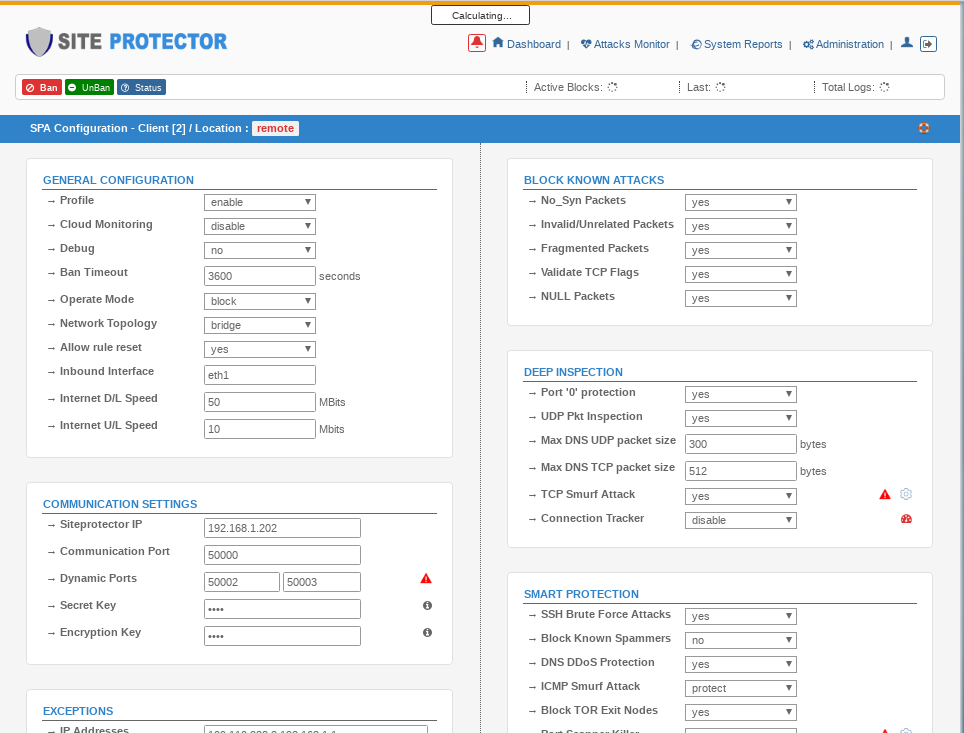
SPRO Management Settings
Maestro Management/ Correlation engine includes dozens of configurations to configure and customize based on your needs. The Maestro correlation engine will auto-adjust its internal mechanisms based on the these parameters.
|
|
Engine Settings
Each engine can be configured separetely. Most of the configurations have been already tuned and minimum input is required by the system administrator.
|
|
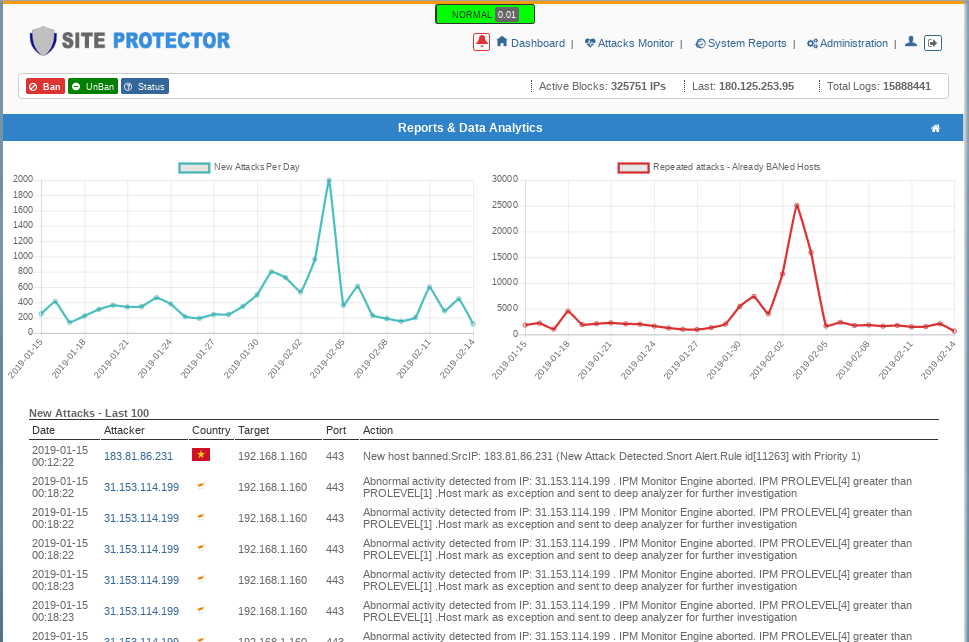
Reports and Data Analytics
Build-in reports and data analytics tools included in the core system. The administrator can easily identify the current security status with a few clicks.
|
|
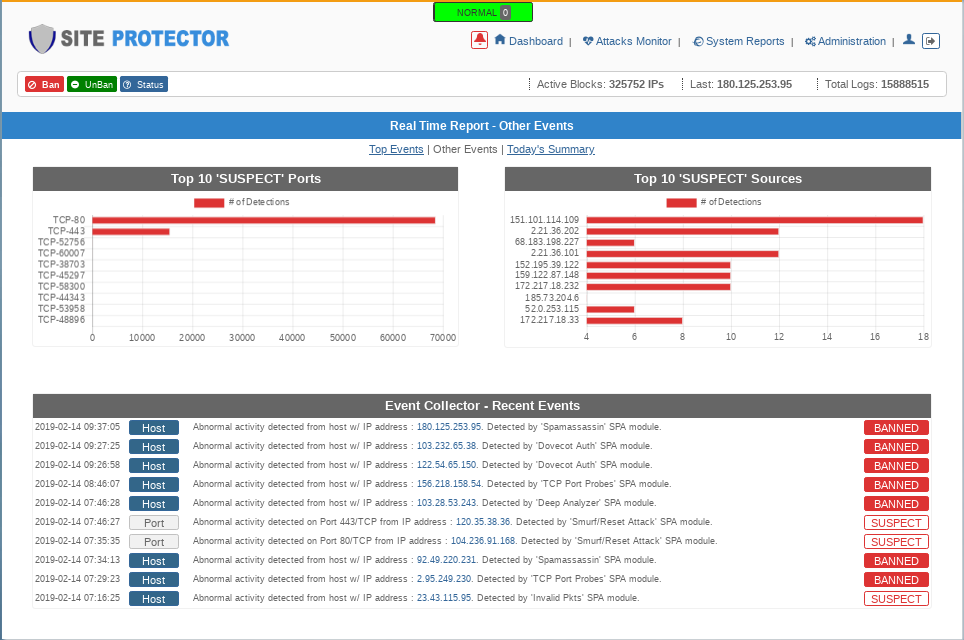
Real Time Reports
Use Real Time reports and see the core functionality of our engine in real time. See how our engine correlate events and how and when a 'ban' executed.
|
|
Screenshots & Features
|
Superb Dashboard Experience
Maestro's dashboard provides a comprehensive overview of your network's security posture. It includes detailed information about attacks, analysis of attack patterns, escalation, ban and unban information, network statistics, DDoS information, and scrubbing center details.
|
NOTE: Below pictures are from an older version of Maestro named SPA Site Protector Appliance
|
Real Time Attack Monitor
View in real time who attacks your systems. Details include : source IP, country , port, protocol, attack target, attack severity and the SPA action
|
Clean Dasboard
Clean Dashboard with network and system statistics, SYN attacks monitor, FLOOD defender , SESSION status and DDoS IP tracker.
|
Management Reports
Detail reports easy to understand and use on any Management presentation. Designed in a way that non-security people may understand.
|
|
Advanced Notification System
SPA includes an advanced and flexible notification system that can be customized for any enviroment. As a start, it can be set to 'Smart Mode' where the system will send selectively any alerts worth your attention based on your configuration.
|
|
Multi User / OPSec & API
Supports multi-user with three main pre-defined roles : Super Admins, Local Admins and Remote Users. A Super Admin is able to see and change ALL systems parameters, the Local Admins can manage the system while is running (ban,unban hosts, generate reports, view logs etc . The Remote Users are able to control basic functions of the SPA ecosystem using an easy to use remote API with basic functionality.
|
|
System Alerts
System alerts are grouped by category and severity. Using the 'alert dashboard' the system administrator can easily identify any critical threads / attacks to your infrastructure.
|
|
SPRO Management Settings
SPA Management/ Correlation engine includes dozens of configurations to configure and customize based on your needs. The SPA correlation engine will auto-adjust its internal mechanisms based on the these parameters.
|
|
Engine Settings
Each engine can be configured separetely. Most of the configurations have been already tuned and minimum input is required by the system administrator.
|
|
Reports and Data Analytics
Build-in reports and data analytics tools included in the core system. The administrator can easily identify the current security status with a few clicks.
|
|
Real Time Reports
Use Real Time reports and see the core functionality of our engine in real time. See how our engine correlate events and how and when a 'ban' executed.
|
|

 Login
Login